Math
Math can be interesting! This is oversimplified, but we can use math for many things. One is that might want to know the position of a motor. In electronics, we might want to know what part of an AC cycle we are in such as reading oscilloscopes. . What is even more interesting, we do not have to have some fancy computer language in most cases to calculate what we need. Then if you want to, you can port the code to a fancier language and or system.


Sine wave graph

$ ./sine
[code]
cat sine.bas
'rem ----------------------------
'rem sine wave
'rem -----------------------------
?
?"Sine wave graph"
?
?
?tab(14);"- 1";tab(40);"0";tab(63);"+ 1"
?"Degrees";tab(14);
for j = 1 to 52
?"-";
Next j
?
for L = 0 to 360 step 7.5
let x = L / 57.19578
'rem what makes the curve
let r = sin(x)
let s = int((r*25) + .5)
if s<0 then? L;tab(s+40);"*";tab(40);":"
if s=0 then ? L;tab(40);"*"
if S>0 then? L;TAB(40);":";tab(s+40);"*"
Next L
end
[/code]
Cosine graph:

$ cat cosine.bas
[code]
'rem ----------------------------
'rem cosine wave
'rem -----------------------------
?
?"Cosine wave graph"
?
?
?tab(14);"- 1";tab(40);"0";tab(63);"+ 1"
?"Degress";tab(14);
for j = 1 to 52
?"-";
Next j
?
for L = 0 to 360 step 7.5
let x = L / 57.19578
'rem what makes the curve
let r = cos(x)
let s = int((r*25) + .5)
if s<0 then? L;tab(s+40);"*";tab(40);":"
if s=0 then ? L;tab(40);"*"
if s>0 then? L;TAB(40);":";tab(s+40);"*"
Next L
end
[/code]
Note: Freebasic was used to compile the code on a Linux based system.
--------------------------------------
Update: For those of you who prefer C, we found some code for the sine and cosine.
Sine:
$ ./sine
sine.c (gcc sine.c -lm -o sine)
[code]
#include <stdio.h>
#include <math.h>
#define WIDTH 60
#define HEIGHT 20
#define X WIDTH/2
#define Y HEIGHT/2
#define XMAX WIDTH-X-1
#define XMIN -(WIDTH-X)
#define YMAX HEIGHT-Y
#define YMIN -(HEIGHT-Y)+1
char grid[HEIGHT][WIDTH];
int plot(int x, int y);
void init_grid(void);
void show_grid(void);
int main()
{
float x,y;
init_grid();
for(x=-3.14159;x<=3.14159;x+=0.1)
{
// line to change (sin, cos, tan, or etc)
y = sin(x);
plot(rintf(x*10),rintf(y*8));
}
show_grid();
return(0);
}
/* Set "pixel" at specific coordinates */
int plot(int x, int y)
{
if( x > XMAX || x < XMIN || y > YMAX || y < YMIN )
return(-1);
grid[Y-y][X+x] = '*';
return(1);
}
/* Initialize grid */
void init_grid(void)
{
int x,y;
for(y=0;y<HEIGHT;y++)
for(x=0;x<WIDTH;x++)
grid[y][x] = ' ';
/* draw the axis */
for(y=0;y<HEIGHT;y++)
grid[y][X] = '|';
for(x=0;x<WIDTH;x++)
grid[Y][x] = '-';
grid[Y][X] = '+';
}
/* display grid */
void show_grid(void)
{
int x,y;
for(y=0;y<HEIGHT;y++)
{
for(x=0;x<WIDTH;x++)
putchar(grid[y][x]);
putchar('\n');
}
}
[/code]
Cosine:

cosine.c (gcc cosine.c -lm -o cosine)
[code]
#include <stdio.h>
#include <math.h>
#define WIDTH 60
#define HEIGHT 20
#define X WIDTH/2
#define Y HEIGHT/2
#define XMAX WIDTH-X-1
#define XMIN -(WIDTH-X)
#define YMAX HEIGHT-Y
#define YMIN -(HEIGHT-Y)+1
char grid[HEIGHT][WIDTH];
int plot(int x, int y);
void init_grid(void);
void show_grid(void);
int main()
{
float x,y;
init_grid();
for(x=-3.14159;x<=3.14159;x+=0.1)
{
// line to change (sin, cos, tan, or etc)
y = cos(x);
plot(rintf(x*10),rintf(y*8));
}
show_grid();
return(0);
}
/* Set "pixel" at specific coordinates */
int plot(int x, int y)
{
if( x > XMAX || x < XMIN || y > YMAX || y < YMIN )
return(-1);
grid[Y-y][X+x] = '*';
return(1);
}
/* Initialize grid */
void init_grid(void)
{
int x,y;
for(y=0;y<HEIGHT;y++)
for(x=0;x<WIDTH;x++)
grid[y][x] = ' ';
/* draw the axis */
for(y=0;y<HEIGHT;y++)
grid[y][X] = '|';
for(x=0;x<WIDTH;x++)
grid[Y][x] = '-';
grid[Y][X] = '+';
}
/* display grid */
void show_grid(void)
{
int x,y;
for(y=0;y<HEIGHT;y++)
{
for(x=0;x<WIDTH;x++)
putchar(grid[y][x]);
putchar('\n');
}
}
[/code]
-------------------
Afterthought add-on
Nice when you can do a neat graphic from the command line.

sphere.c (gcc sphere.c -lm -o sphere)
{code]
#include <stdio.h>
#include <stdlib.h>
#include <string.h>
#include <ctype.h>
#include <math.h>
const char *shades = ".:!*oe&#%@";
double light[3] = { 30, 30, -50 };
void normalize(double * v)
{
double len = sqrt(v[0]*v[0] + v[1]*v[1] + v[2]*v[2]);
v[0] /= len; v[1] /= len; v[2] /= len;
}
double dot(double *x, double *y)
{
double d = x[0]*y[0] + x[1]*y[1] + x[2]*y[2];
return d < 0 ? -d : 0;
}
void draw_sphere(double R, double k, double ambient)
{
int i, j, intensity;
double b;
double vec[3], x, y;
for (i = floor(-R); i <= ceil(R); i++) {
x = i + .5;
for (j = floor(-2 * R); j <= ceil(2 * R); j++) {
y = j / 2. + .5;
if (x * x + y * y <= R * R) {
vec[0] = x;
vec[1] = y;
vec[2] = sqrt(R * R - x * x - y * y);
normalize(vec);
b = pow(dot(light, vec), k) + ambient;
intensity = (1 - b) * (sizeof(shades) - 1);
if (intensity < 0) intensity = 0;
if (intensity >= sizeof(shades) - 1)
intensity = sizeof(shades) - 2;
putchar(shades[intensity]);
} else
putchar(' ');
}
putchar('\n');
}
}
int main()
{
normalize(light);
draw_sphere(15, 4, .1);
// draw_sphere(10, 2, .4);
return 0;
}
[/code]
Bash based code:
Change it into a cosine wave by changine line 9 from sine to cos.
vert_plot=$(awk “BEGIN{ printf \”%.12f\”, ((cos($angle*($PI/180))*$amplitude)+$centreline)}
Sine wave graph
$ ./sine
[code]
cat sine.bas
'rem ----------------------------
'rem sine wave
'rem -----------------------------
?
?"Sine wave graph"
?
?
?tab(14);"- 1";tab(40);"0";tab(63);"+ 1"
?"Degrees";tab(14);
for j = 1 to 52
?"-";
Next j
?
for L = 0 to 360 step 7.5
let x = L / 57.19578
'rem what makes the curve
let r = sin(x)
let s = int((r*25) + .5)
if s<0 then? L;tab(s+40);"*";tab(40);":"
if s=0 then ? L;tab(40);"*"
if S>0 then? L;TAB(40);":";tab(s+40);"*"
Next L
end
[/code]
Cosine graph:
$ cat cosine.bas
[code]
'rem ----------------------------
'rem cosine wave
'rem -----------------------------
?
?"Cosine wave graph"
?
?
?tab(14);"- 1";tab(40);"0";tab(63);"+ 1"
?"Degress";tab(14);
for j = 1 to 52
?"-";
Next j
?
for L = 0 to 360 step 7.5
let x = L / 57.19578
'rem what makes the curve
let r = cos(x)
let s = int((r*25) + .5)
if s<0 then? L;tab(s+40);"*";tab(40);":"
if s=0 then ? L;tab(40);"*"
if s>0 then? L;TAB(40);":";tab(s+40);"*"
Next L
end
[/code]
Note: Freebasic was used to compile the code on a Linux based system.
--------------------------------------
Update: For those of you who prefer C, we found some code for the sine and cosine.
Sine:
$ ./sine

sine.c (gcc sine.c -lm -o sine)
[code]
#include <stdio.h>
#include <math.h>
#define WIDTH 60
#define HEIGHT 20
#define X WIDTH/2
#define Y HEIGHT/2
#define XMAX WIDTH-X-1
#define XMIN -(WIDTH-X)
#define YMAX HEIGHT-Y
#define YMIN -(HEIGHT-Y)+1
char grid[HEIGHT][WIDTH];
int plot(int x, int y);
void init_grid(void);
void show_grid(void);
int main()
{
float x,y;
init_grid();
for(x=-3.14159;x<=3.14159;x+=0.1)
{
// line to change (sin, cos, tan, or etc)
y = sin(x);
plot(rintf(x*10),rintf(y*8));
}
show_grid();
return(0);
}
/* Set "pixel" at specific coordinates */
int plot(int x, int y)
{
if( x > XMAX || x < XMIN || y > YMAX || y < YMIN )
return(-1);
grid[Y-y][X+x] = '*';
return(1);
}
/* Initialize grid */
void init_grid(void)
{
int x,y;
for(y=0;y<HEIGHT;y++)
for(x=0;x<WIDTH;x++)
grid[y][x] = ' ';
/* draw the axis */
for(y=0;y<HEIGHT;y++)
grid[y][X] = '|';
for(x=0;x<WIDTH;x++)
grid[Y][x] = '-';
grid[Y][X] = '+';
}
/* display grid */
void show_grid(void)
{
int x,y;
for(y=0;y<HEIGHT;y++)
{
for(x=0;x<WIDTH;x++)
putchar(grid[y][x]);
putchar('\n');
}
}
[/code]
Cosine:
cosine.c (gcc cosine.c -lm -o cosine)
[code]
#include <stdio.h>
#include <math.h>
#define WIDTH 60
#define HEIGHT 20
#define X WIDTH/2
#define Y HEIGHT/2
#define XMAX WIDTH-X-1
#define XMIN -(WIDTH-X)
#define YMAX HEIGHT-Y
#define YMIN -(HEIGHT-Y)+1
char grid[HEIGHT][WIDTH];
int plot(int x, int y);
void init_grid(void);
void show_grid(void);
int main()
{
float x,y;
init_grid();
for(x=-3.14159;x<=3.14159;x+=0.1)
{
// line to change (sin, cos, tan, or etc)
y = cos(x);
plot(rintf(x*10),rintf(y*8));
}
show_grid();
return(0);
}
/* Set "pixel" at specific coordinates */
int plot(int x, int y)
{
if( x > XMAX || x < XMIN || y > YMAX || y < YMIN )
return(-1);
grid[Y-y][X+x] = '*';
return(1);
}
/* Initialize grid */
void init_grid(void)
{
int x,y;
for(y=0;y<HEIGHT;y++)
for(x=0;x<WIDTH;x++)
grid[y][x] = ' ';
/* draw the axis */
for(y=0;y<HEIGHT;y++)
grid[y][X] = '|';
for(x=0;x<WIDTH;x++)
grid[Y][x] = '-';
grid[Y][X] = '+';
}
/* display grid */
void show_grid(void)
{
int x,y;
for(y=0;y<HEIGHT;y++)
{
for(x=0;x<WIDTH;x++)
putchar(grid[y][x]);
putchar('\n');
}
}
[/code]
-------------------
Afterthought add-on
Nice when you can do a neat graphic from the command line.
sphere.c (gcc sphere.c -lm -o sphere)
{code]
#include <stdio.h>
#include <stdlib.h>
#include <string.h>
#include <ctype.h>
#include <math.h>
const char *shades = ".:!*oe&#%@";
double light[3] = { 30, 30, -50 };
void normalize(double * v)
{
double len = sqrt(v[0]*v[0] + v[1]*v[1] + v[2]*v[2]);
v[0] /= len; v[1] /= len; v[2] /= len;
}
double dot(double *x, double *y)
{
double d = x[0]*y[0] + x[1]*y[1] + x[2]*y[2];
return d < 0 ? -d : 0;
}
void draw_sphere(double R, double k, double ambient)
{
int i, j, intensity;
double b;
double vec[3], x, y;
for (i = floor(-R); i <= ceil(R); i++) {
x = i + .5;
for (j = floor(-2 * R); j <= ceil(2 * R); j++) {
y = j / 2. + .5;
if (x * x + y * y <= R * R) {
vec[0] = x;
vec[1] = y;
vec[2] = sqrt(R * R - x * x - y * y);
normalize(vec);
b = pow(dot(light, vec), k) + ambient;
intensity = (1 - b) * (sizeof(shades) - 1);
if (intensity < 0) intensity = 0;
if (intensity >= sizeof(shades) - 1)
intensity = sizeof(shades) - 2;
putchar(shades[intensity]);
} else
putchar(' ');
}
putchar('\n');
}
}
int main()
{
normalize(light);
draw_sphere(15, 4, .1);
// draw_sphere(10, 2, .4);
return 0;
}
[/code]
Bash based code:

1
2
3
4
5
6
7
8
9
10
11
12
13
14
15
16
17
18
19
20
21
22
23
24
25
26
27
28
29
30
31
32
33
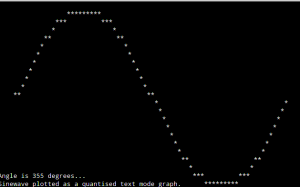
| #!/bin/bash# plotsine.sh# A DEMO to display a sinewave inside a standard bash terminal.# Issued as Public Domain, 2014, B.Walker, G0LCU.# Device: Macbook Pro 13", OSX 10.7.5, default bash terminal.# Use variables so that you can see how it works.angle=0step_angle=5vert_plot=0horiz_plot=5centreline=12amplitude=11PI=3.14159clear# Do a single cycle, quantised graph.while [ $angle -le 359 ]do# Create each floating point value...# CygWin now catered for... ;o)vert_plot=$(awk "BEGIN{ printf \"%.12f\", ((sin($angle*($PI/180))*$amplitude)+$centreline)}")#vert_plot=$(bc -l <<< "{print ((s($angle*($PI/180))*$amplitude)+$centreline)}")# Truncate the floating point value to an integer then invert the plot to suit the x y co-ordinates inside a terminal...vert_plot=$((24-${vert_plot/.*}))# Plot the point(s) and print the angle at that point...printf "\x1B["$vert_plot";"$horiz_plot"f*"printf "\x1B[22;1fAngle is $angle degrees..."sleep 0.1# Increment values...angle=$((angle+step_angle))horiz_plot=$((horiz_plot+1))doneprintf "\x1B[23;1fSinewave plotted as a quantised text mode graph.\n"exit |
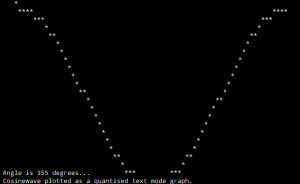
vert_plot=$(awk “BEGIN{ printf \”%.12f\”, ((cos($angle*($PI/180))*$amplitude)+$centreline)}


Comments
Post a Comment