Be a sort of weather person.
You can get all kinds of gadgets for your desktop that usually sit on
the top panel. One of them that can be very important is the weather.
The unit is called a barometer, which was allegedly invented in 1643 by
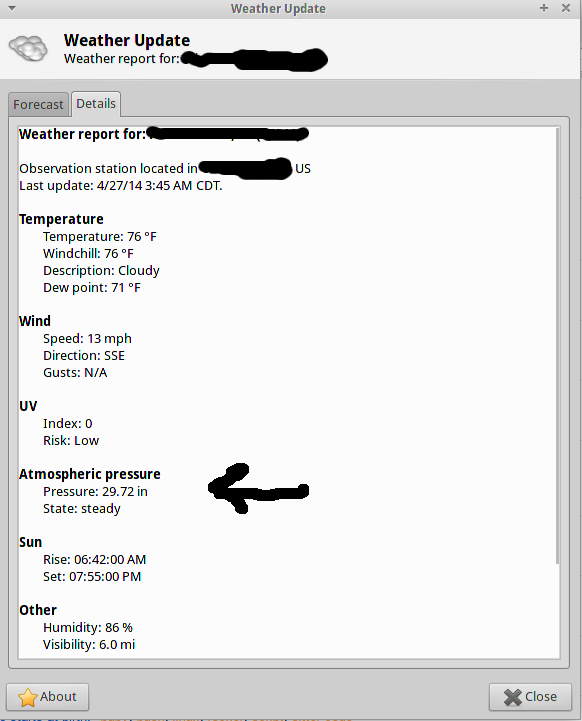
Evangelista Torricelli. You may need to elect to display the barometric
pressure on your panel outtake.
Normally during clear weather, the measure is above 30. Where you may live it may vary. In our case, the pressure is dropping. This can mean that rain is coming. And rain is in the forecast for the next day or so, Gives you a chance to outsmart the weatherman. So higher pressure is good weather for the most part.
Not only can you predict the weather, you might predict when the fish might bite! Fish are much more comfortable when there's stable high pressure, and tend to feed actively most anywhere within the water column. So do not expect good fishing if it is going to get cold or bad weather is coming.
You can build your own non-precise barometer with materials around the house. A jar, balloon, tape, a straw, and a chart are pretty much what you need to build it. The main thing you want to look at are the trends. Is the straw going down, up, or just sitting still.
Have fun!
Something else, you might like: http://computoman.blogspot.com/2013/09/weather-report.html


Comments
Post a Comment